Showing posts with label integrating writing with math. Show all posts

Saturday, March 30, 2013

Bats

One of the many things I miss about teaching is the opportunity to be creative.  (I know, it seems that the powers that be are doing their very best to take this away from teachers. Sad.)

A friend asked me to sub in her third grade classroom for two consecutive days and allowed me to create a project for her students.

This is the result of the two days.


Students answered the question about whether or not they have ever seen a bat by stamping the bat stamp in the yes or no column on our survey.

They answered the first two question in their 'bat book' that is from http://www.kidzone.ws/animals/bats/ws12.htm.  They took a few minutes to talk about what they know and what they wanted to learn with their team.  

Then we read the book Bats by Gail Gibbons.  On chart paper we logged interesting facts as we read the book.  We discussed the diagram in her book.  We talked about the bat life cycle.  They completed the back page of their 'bat book' and set it aside for later.

Students drew the border line around the construction paper edge using a ruler.

On a separate piece of paper students drew the (1) life cycle of a brown bat and labeled it.

My example shows the little brown bat life cycle from www.kidzone.ws as I didn't have time to draw it.


(Just so you know, ahead of time I cut paper for all of the learning I wanted presented on the poster.  I've done these before where spaces were bordered for learning presentation and some students have a tough time recreating the spaces they see.  As I was short on time I thought the paper would help with spacing and it also created some fun.  There's just something about pockets and little books and folding paper.) 

They folded the life cycle paper in thirds and applied glue to the middle section on the back.  It was glued in the bottom right corner.  I stressed getting it close to the border lines but not covering up the border lines.

Next they drew a (2) diagram of the parts of a bat and labeled it.  It was glued next to the life cycle.


The 'bat book' presented a problem as it could not be glued to the poster without losing information or taking up too much space (and some of it upside down!).  A pocket was created to hold the book.  I think this might have been the highlight of the poster.

Using a rectangle, the ends were folded under.  Glue was put on the folded under part and along the bottom of the paper (under the folded part, too).  The (3) pocket was placed on the poster next to the diagram.  I'm sorry I don't have a picture illustrating making the pocket.

During math time the students completed the Bat Wing Span book.  I had hoped we would have time to survey students about myths (http://www.bats4kids.org/) and feelings about bats to create data for graphs and to analyze, but there wasn't time.

I created the book using Publisher.  The wing span chart was created in Excel using data I found on various websites.


If you don't know how to make a little book, I found this video to help.   http://www.youtube.com/watch?v=mmPZlFBR6I8

We completed the (4) book and added it to our poster. 


During Science time we review what we read earlier by reading and talking about the following website.  http://www.globio.org/glossopedia/article.aspx?art_id=45&art_nm=Bats


In writing we started a paragraph about what we have learned about bats.

The next day we started off with the book Stellaluna by Janell Cannon. 
As we read we logged differences between bats and birds.    Using a venn diagram from math-aids.com (I added clip art of a bat and a bird) students compared and contrasted birds and bats.  The (6) venn diagram was ready to be added to the poster.  On my example we waited until we had the facts and opinions done and then added all three to the poster.  

The little 'matchbooks' are a fun way to add  (5) facts and opinions to the poster.  Once again we were running short of time so I limited the facts to two and the opinions to two.


We added, reviewed, edited, and rewrote the (7) paragraph about what was learned to the piece of notebook paper custom cut to fit the space left on the poster.  For kids who like to write a lot, a second sheet was added and students were instructed to not write on the top line.  I used that as a glue line to attached the top (first page) and their writing was two pages, the top one flapped open.


Finally, the best part!   A chance to (8) illustrate a bat.  I didn't give them paper for this, it was done to the poster paper.


To finish the poster a (9) title and border was added.  Students who finished early could add an illustration of another bat on the pocket and fact/opinion matchbooks.


If we would have had more time I think it would be fun to write a story with a bat as a main character.  I read Bat Love the Night by Nicola Davies to the students.  This would be a great opportunity to work on descriptive words and adding voice to writing.


Sunday, July 15, 2012

IF YOU WERE AN EEL, HOW WOULD YOU FEEL?

A new project I would like to try is fractions with the book IF YOU WERE AN EEL, WHAT WOULD YOU FEEL? by Mina and Howard Simon.   After reading and talking about the book I would explain to the students they are going to write a story using the pattern of this book about fractions.   A sample title would be If You Were One-Half, How Would You Feel?

If you were one-half, how would you feel?
Or one-fourth
or one-third
or one eighth
how would you feel?

(You could change these to two-thirds, three-fourths depending on the level of your students.)

Say I were one-half -

As one-half
I would feel
like half of a whole.
I would be like
half of a pizza
or half of a glass of milk
or half of a twin
or half of a dollar (50 cents!)
or the number two when thinking of four
or half of an inch.

Say I were one-third -
As one third
I would feel
like an apple with two cherries.
I would be like
a dime in 30 cents
or

I would let students illustrate their content.  To make the book a bit thicker, I wouldn't list all of the or statements on one page as the Simon's did in their book, I would put them on their own page.   Illustrations can be hand drawn after printing the book or use clip art.

My favorite program is Publisher for something like this. (Don't forget Publisher has a booklet feature you could use to save on paper and ink.)  Either print the file or save the file (don't use booklet feature and if you used clip art) as a pdf file and use studentpublishing.com to publish the books.

Make sure you credit the the authors (Mina and Howard Simon) for using their book.  It would be nice if you would include this website on your finished project, too.

I think you could also use this book as a springboard to a book on shapes and the attributes of shapes.

Just for fun:   website for thirds...http://www.oswego.org/ocsd-web/games/fractionflags/ffthirds.html


Tuesday, February 14, 2012

Transformations

The students created a short video using PhotoStory3 (a free download), Word and PowerPoint.

Here is a link to student examples.  Directions below.  http://mrscooksfantasticfourthgrade.blogspot.com/2012/02/transformations.html


In Word we wrote a few sentences explaining translation.  After we wrote the sentences we used an animal figurine (we used a chicken or rooster) to demonstrate translation on a grid.  Then, using italics, we added the information about pictures we wanted to add to the paragraph. 

1.       Example Paragraph:
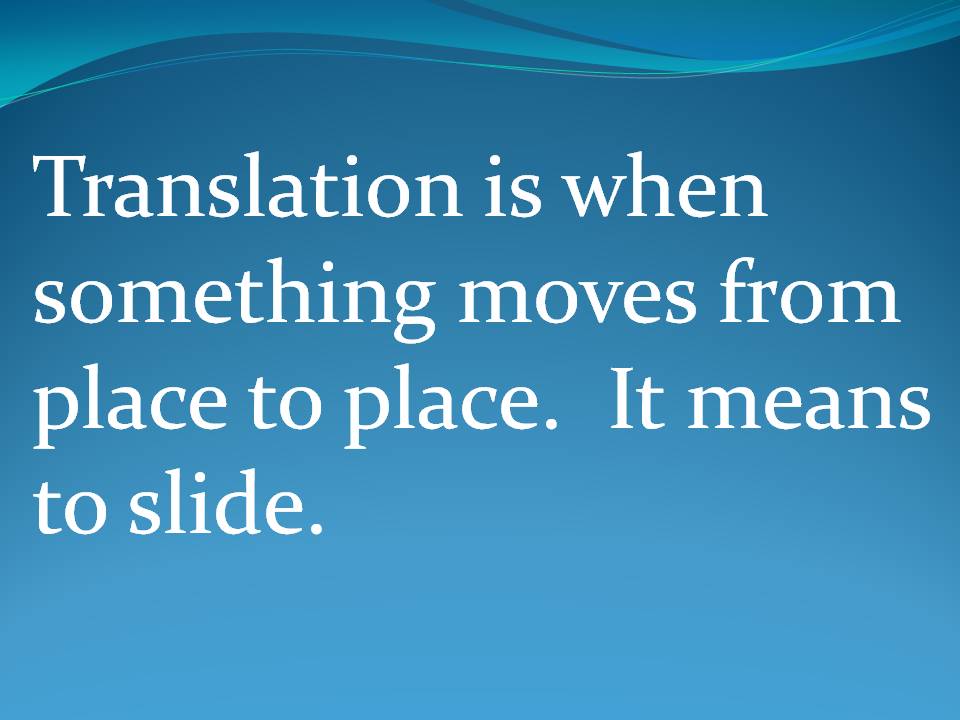
Translation is when something moves from place to place.  It means to slide.  I can remember slide and translation are the same by the sl in both words.

2.        
After the paragraph, the students figured out how to show slide with the animal and the grid.  They added this information to their paragraph in italics.

Translation is when something moves from place to place.  It means to slide.  (Picture one:  chicken on (4,4))  (Picture two:  chicken on (5,4))  I can remember slide and translation are the same by the sl in both words.


Now for the fun part!  Take the pictures of the chicken using the directions determined earlier
.
(When the pictures were inserted into PowerPoint, they were edited using picture tools.)
5.        
Repeat the process with reflection, then with rotation.

6.        
Open PowerPoint and create a title page.  Then type the transformation information on a slide or copy and paste from the Word document.  Leave a blank slide for each picture. Insert pictures in the correct places.  Draw a red line to show the movement.  Do this for rotation and reflection.


 Then save the powerpoint as jpeg files.


 After files are converted to jpeg files, open PhotoStory3 and import the pictures.  Once the pictures are imported you will want to change the motion (transitions) on the pictures.  We left the first two slides alone and allowed the defaulted transitions to happen, then we fixed the transitions on the rest of the slides. 


If you don't do this, your movie will look like this.  We think it is distracting.


This movie has the transitions fixed.


Friday, December 9, 2011

Gingerbread Glyphs and More

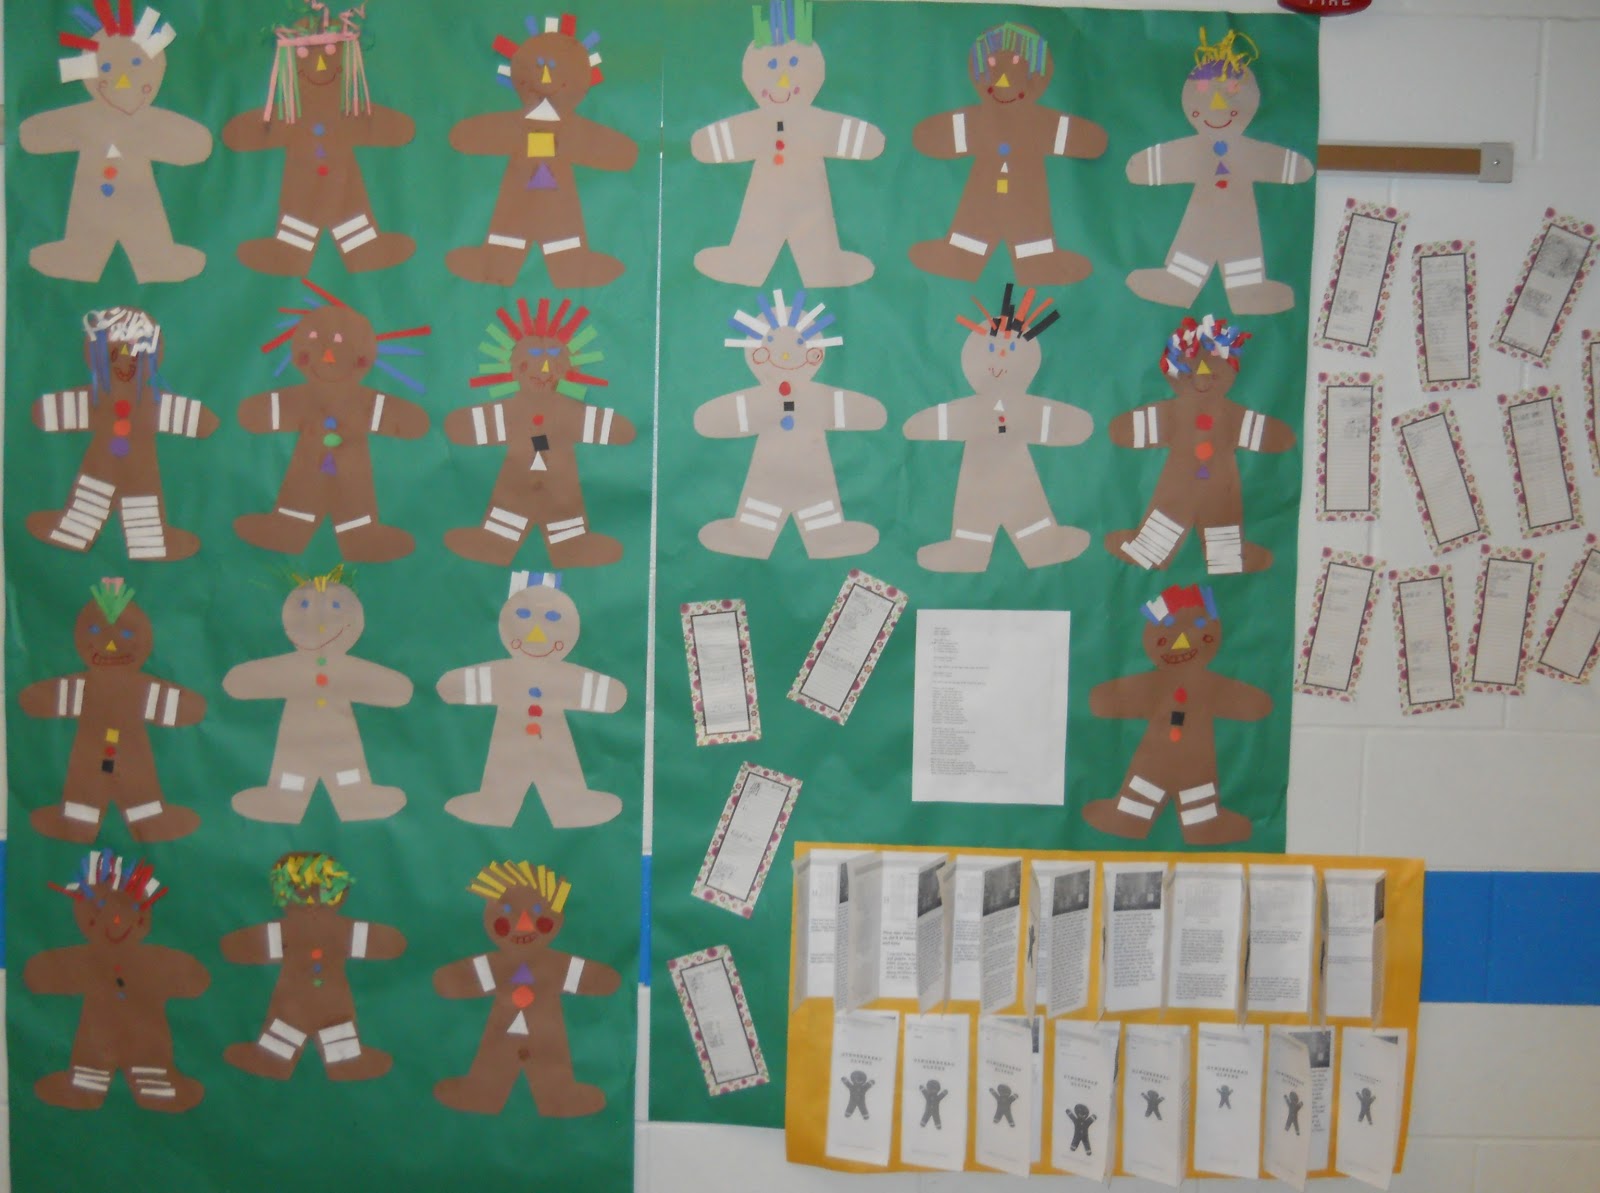
Gingerbread glyphs are a great way to brighten the hallways and combine reading and math.  The glyph I like to use is from Mailbox.  I found this link and used it this year.  http://teachers.net/lessons/posts/1415.html
I asked the students to highlight their responses on the form.  I let them choose three from the "things I like to do" list.  The ages didn't fit my classroom so I changed them to fit.

After constructing the gingerbread man, each student was assigned one of the questions to collect data.  We discussed tally marks and how to bundle them and why.  We talked about how many tally marks should end up in the data collection.

We used the collected data to create a graph using the data.  We used http://nces.ed.gov/nceskids/createagraph/default.aspx.  Students downloaded their graph as a jpg file.
Next we opened Publisher and clicked on a brochure template.  We deleted a lot of the information on the brochure and created our own text boxes.  Adding a clip art picture of a gingerbread man added a little extra fun to our project.  Each student inserted the graph they made and created a text box under it to analyze the data in their graph.  Students inserted a graph from a classmate from each one of the questions.  They created a text box to write about what they liked about the project and what they learned.  We had one side of the brochure left so students wrote a story about their gingerbread man.


Thursday, November 17, 2011

Word Problems - Signal Words


We worked on reviewing signal words for addition and subtraction word problems.  While this seems pretty basic and I know that not all problems will contain these words, too many students don't understand which operation to use.  

Each student created two word problems using two different signal words for addition and then for subtraction.  They used Publisher, printed and then cut them apart.  We glued them to butcher paper to display in the hallway.  The kids loved that the number sentence was upside down on their screen.  I showed them how to rotate it and some forgot to rotate it back.  

When printing, don't forget to change the screen to two-sided.  Below is an example of page 1 in the Publisher file.


Here is page 2 as it would look on the screen.


After the word problems were checked by me, they were allowed to find a clip art picture to place on the problem.

Wish I would have outlined the pictures so you could see them better.  The first page text boxes were near the bottom of the landscaped page, the second page boxes were at the top.

Signal words we used were:  addition:  altogether, added, total, in all, plus, sum; subtraction:  left, how many...more...than, how many...less...than, difference, lost, shorter, longer

Saturday, March 12, 2011

ABC Measurement Books

The books are done and ready to be submitted for publishing.  As posted before, the students created the books using Publisher.  All pages had two letters except the last two pages which had three.  (The publisher lets us have 12 pages of content per book.) We brainstormed measurement words for each letter.  Some letters were tough.  We finally settled on number line for n and students were tying it to a ruler or thermometer.

We are getting the books published at StudentPublishing.com.  We had books published there earlier this year and loved them.  The software on the company's website is slow although it created a wonderful book.  We have to use the company's site to create the cover page, the title page, the dedication page and author page.  We uploaded our PDF file for the other pages.  I like this method much better.

The last time I created a chart to keep track of each student's pages as they were reviewed by an adult.  It was a long process checking each page of each book for each student and the software was slow.  I'm not checking them as closely this time as I told the students THEY should have pride in their work and THEY should make sure everything is the way they want it.  (We did do some editing with the Publisher file before converting the file to a PDF.)

The students uploaded the PDF file into their book at the publishing company's website.  We should get the books in about 4 weeks.