Showing posts with label integrating technology with math. Show all posts

Sunday, July 15, 2012

IF YOU WERE AN EEL, HOW WOULD YOU FEEL?

A new project I would like to try is fractions with the book IF YOU WERE AN EEL, WHAT WOULD YOU FEEL? by Mina and Howard Simon.   After reading and talking about the book I would explain to the students they are going to write a story using the pattern of this book about fractions.   A sample title would be If You Were One-Half, How Would You Feel?

If you were one-half, how would you feel?
Or one-fourth
or one-third
or one eighth
how would you feel?

(You could change these to two-thirds, three-fourths depending on the level of your students.)

Say I were one-half -

As one-half
I would feel
like half of a whole.
I would be like
half of a pizza
or half of a glass of milk
or half of a twin
or half of a dollar (50 cents!)
or the number two when thinking of four
or half of an inch.

Say I were one-third -
As one third
I would feel
like an apple with two cherries.
I would be like
a dime in 30 cents
or

I would let students illustrate their content.  To make the book a bit thicker, I wouldn't list all of the or statements on one page as the Simon's did in their book, I would put them on their own page.   Illustrations can be hand drawn after printing the book or use clip art.

My favorite program is Publisher for something like this. (Don't forget Publisher has a booklet feature you could use to save on paper and ink.)  Either print the file or save the file (don't use booklet feature and if you used clip art) as a pdf file and use studentpublishing.com to publish the books.

Make sure you credit the the authors (Mina and Howard Simon) for using their book.  It would be nice if you would include this website on your finished project, too.

I think you could also use this book as a springboard to a book on shapes and the attributes of shapes.

Just for fun:   website for thirds...http://www.oswego.org/ocsd-web/games/fractionflags/ffthirds.html


Tuesday, February 14, 2012

Transformations

The students created a short video using PhotoStory3 (a free download), Word and PowerPoint.

Here is a link to student examples.  Directions below.  http://mrscooksfantasticfourthgrade.blogspot.com/2012/02/transformations.html


In Word we wrote a few sentences explaining translation.  After we wrote the sentences we used an animal figurine (we used a chicken or rooster) to demonstrate translation on a grid.  Then, using italics, we added the information about pictures we wanted to add to the paragraph. 

1.       Example Paragraph:
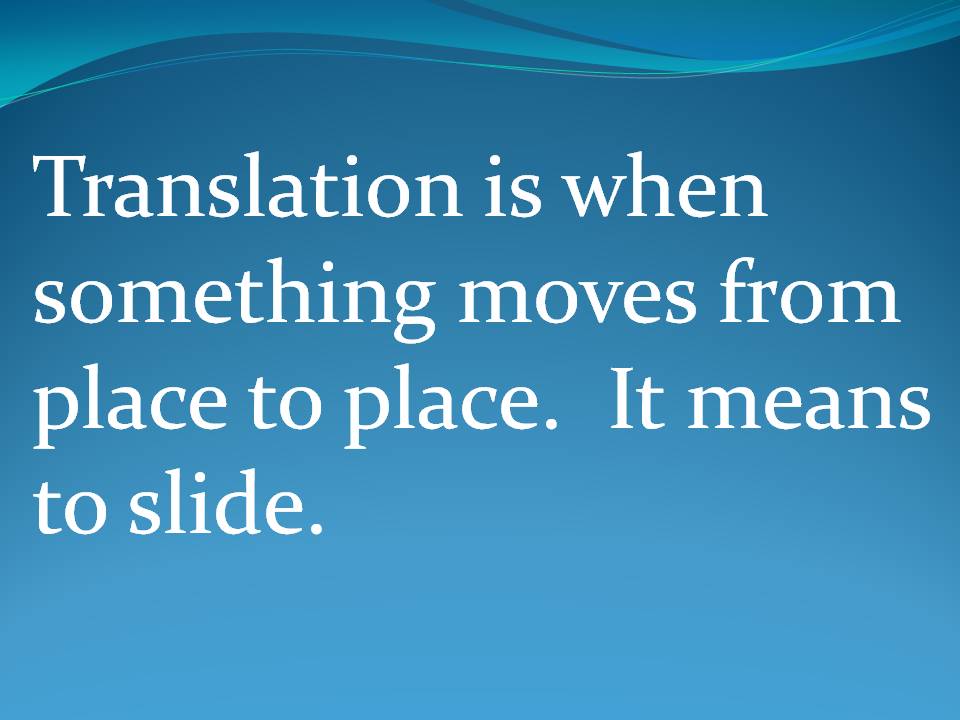
Translation is when something moves from place to place.  It means to slide.  I can remember slide and translation are the same by the sl in both words.

2.        
After the paragraph, the students figured out how to show slide with the animal and the grid.  They added this information to their paragraph in italics.

Translation is when something moves from place to place.  It means to slide.  (Picture one:  chicken on (4,4))  (Picture two:  chicken on (5,4))  I can remember slide and translation are the same by the sl in both words.


Now for the fun part!  Take the pictures of the chicken using the directions determined earlier
.
(When the pictures were inserted into PowerPoint, they were edited using picture tools.)
5.        
Repeat the process with reflection, then with rotation.

6.        
Open PowerPoint and create a title page.  Then type the transformation information on a slide or copy and paste from the Word document.  Leave a blank slide for each picture. Insert pictures in the correct places.  Draw a red line to show the movement.  Do this for rotation and reflection.


 Then save the powerpoint as jpeg files.


 After files are converted to jpeg files, open PhotoStory3 and import the pictures.  Once the pictures are imported you will want to change the motion (transitions) on the pictures.  We left the first two slides alone and allowed the defaulted transitions to happen, then we fixed the transitions on the rest of the slides. 


If you don't do this, your movie will look like this.  We think it is distracting.


This movie has the transitions fixed.


Monday, February 13, 2012

Gallon Man Project

To help students understand the relationship between cups, pints, quarts and gallons each student made a gallon man.


I wanted students to show off their knowledge so they made a postcard using a template from Publisher.  They took a picture of their gallon man and pulled it into the postcard.  

page 1

page 2


The above pictures show the template we used and what page 1 and page 2 looked like.  Below shows the final project (page 1 only) and how to print on both sides.  We printed it so that two printed on a page.  Students cut the postcards out.  Each student took one home and the other one is hanging in the hallway.

Final Postcard Project


Friday, December 9, 2011

Gingerbread Glyphs and More

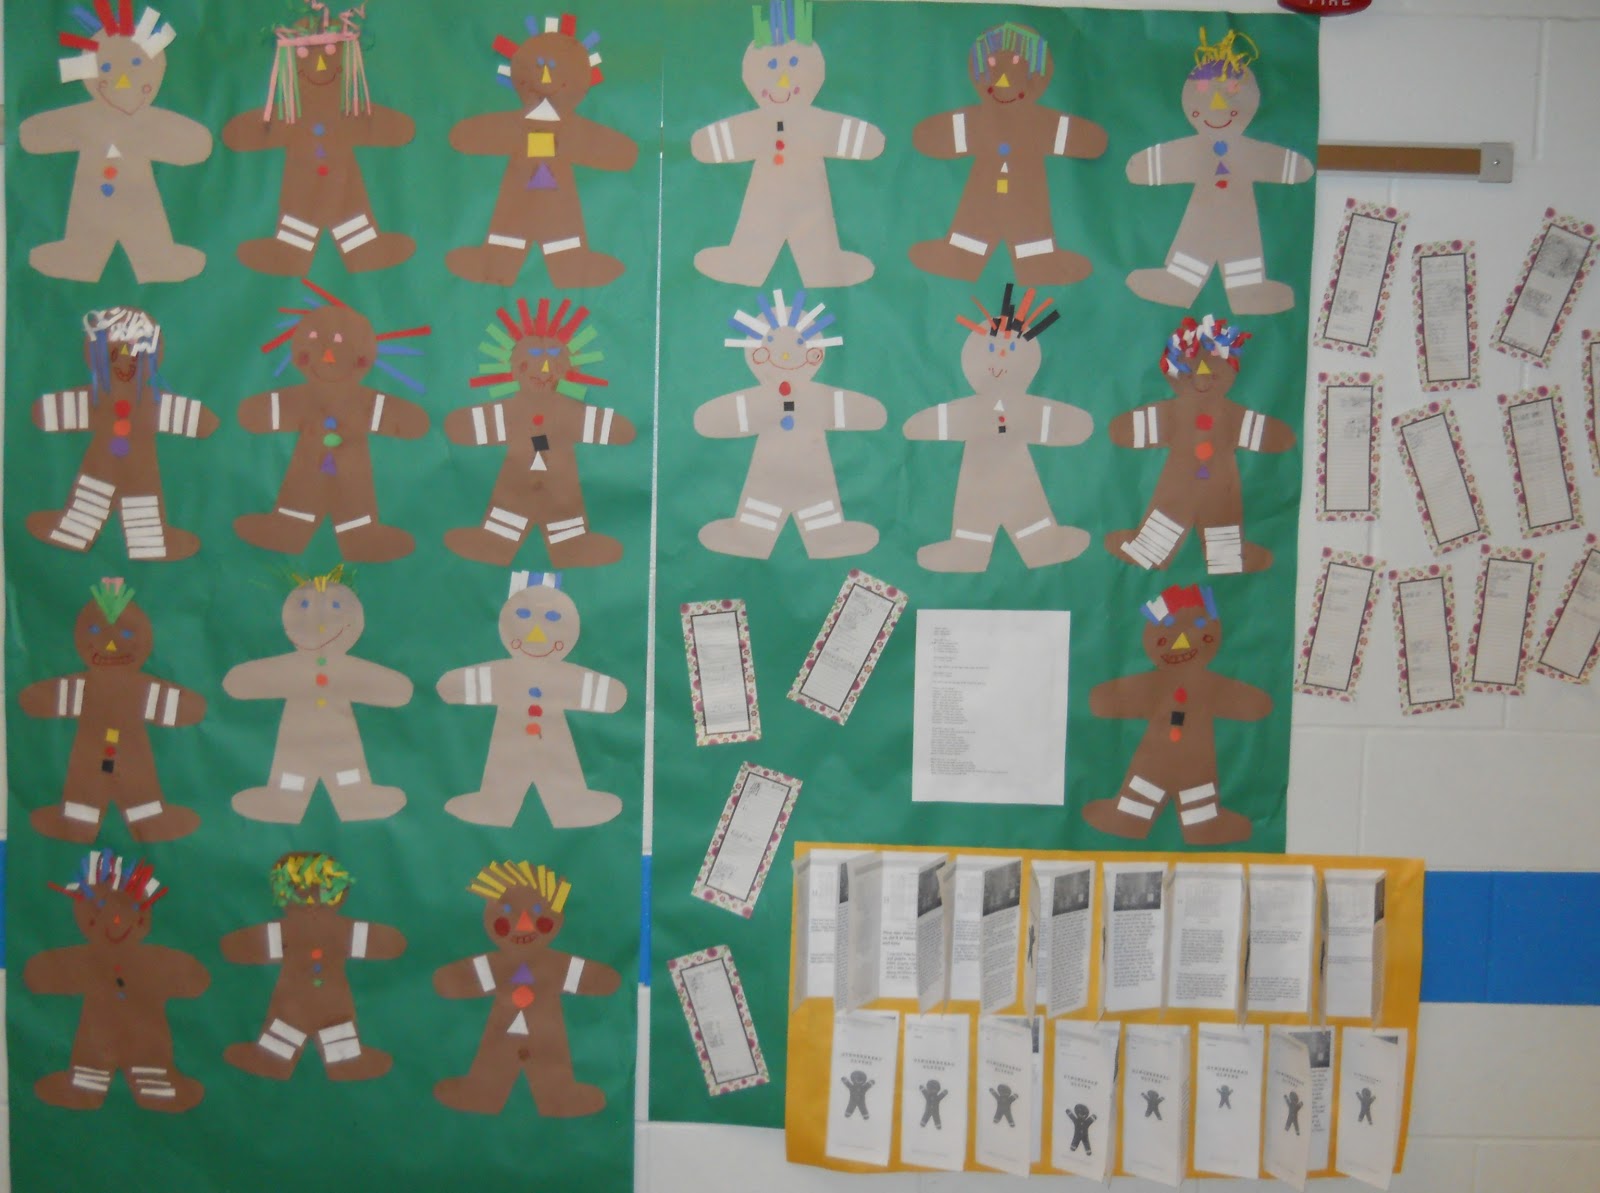
Gingerbread glyphs are a great way to brighten the hallways and combine reading and math.  The glyph I like to use is from Mailbox.  I found this link and used it this year.  http://teachers.net/lessons/posts/1415.html
I asked the students to highlight their responses on the form.  I let them choose three from the "things I like to do" list.  The ages didn't fit my classroom so I changed them to fit.

After constructing the gingerbread man, each student was assigned one of the questions to collect data.  We discussed tally marks and how to bundle them and why.  We talked about how many tally marks should end up in the data collection.

We used the collected data to create a graph using the data.  We used http://nces.ed.gov/nceskids/createagraph/default.aspx.  Students downloaded their graph as a jpg file.
Next we opened Publisher and clicked on a brochure template.  We deleted a lot of the information on the brochure and created our own text boxes.  Adding a clip art picture of a gingerbread man added a little extra fun to our project.  Each student inserted the graph they made and created a text box under it to analyze the data in their graph.  Students inserted a graph from a classmate from each one of the questions.  They created a text box to write about what they liked about the project and what they learned.  We had one side of the brochure left so students wrote a story about their gingerbread man.


Thursday, November 17, 2011

Word Problems - Signal Words


We worked on reviewing signal words for addition and subtraction word problems.  While this seems pretty basic and I know that not all problems will contain these words, too many students don't understand which operation to use.  

Each student created two word problems using two different signal words for addition and then for subtraction.  They used Publisher, printed and then cut them apart.  We glued them to butcher paper to display in the hallway.  The kids loved that the number sentence was upside down on their screen.  I showed them how to rotate it and some forgot to rotate it back.  

When printing, don't forget to change the screen to two-sided.  Below is an example of page 1 in the Publisher file.


Here is page 2 as it would look on the screen.


After the word problems were checked by me, they were allowed to find a clip art picture to place on the problem.

Wish I would have outlined the pictures so you could see them better.  The first page text boxes were near the bottom of the landscaped page, the second page boxes were at the top.

Signal words we used were:  addition:  altogether, added, total, in all, plus, sum; subtraction:  left, how many...more...than, how many...less...than, difference, lost, shorter, longer

Monday, September 26, 2011

Reading Large Numbers

I wanted the students to get a chance to work with PowerPoint and we needed practice with commas and reading large numbers.  We combined the two in an project that will end up being a how to movie on reading large numbers.  Yes, a movie.

First I walked them through creating text boxes, changing fonts/sizes, moving boxes, duplicating screens, and moving items behind or forward.  We did the first 23 slides together.  Seems like a lot but several slides only had one thing changed on them as we "walked" the commas to their spot in the big number and we labeled place value spots.  The students were responsible for the last four slides.  I expect the last four slides to duplicate theprevious last four slides we did together except the number should a new one.  The first slide of the last four had the new number on it.  The second slide had the millions place highlighted (by putting a yellow box behind the millions place) and the words reading the number were highlighted and typed below.  The third slide had the thousands place highlighted in orange and the words highlighted in orange.  The fourth slide had the ones, tens and hundreds highlighted in blue with the words for the numbers highlighted in blue below.

After completing the slides we saved our file and then saved it again as jpg files.  To do this click save as and change the file type to jpg.  PowerPoint will ask if you want one slide or all.  We wanted all.  All of the files were converted to jpg files and placed into a folder for later use.

We opened PhotoStory3 and imported our jpg files from the PowerPoint.  We did all of them at once.  To make it easy we changed our view of the jpg files in the folder to a list.  We clicked the first file, pressed shift, clicked the last file and then clicked open.  ( I think that is what the pop-up window said...)

Next we started adding the audio to our movie.  Students were instructed to read the words on the slide but were also told they could had more verbal words if needed to make their how to video clearer.

Our last step will be to preview and make any corrections to the audio.   Then we will create the video.  I'm happy they will be ready for conferences.

I would have liked to completed this with Windows Movie Maker but the students use Netbooks and the Netbooks struggle to run WMM.  Once we have the video done with PhotoStory3 we could convert the file and pull it into WMM on a bigger machine and add a credits screen.  We'll see if we have time for that part.  I only have one machine for WMM in the classroom.

Saturday, March 12, 2011

ABC Measurement Books

The books are done and ready to be submitted for publishing.  As posted before, the students created the books using Publisher.  All pages had two letters except the last two pages which had three.  (The publisher lets us have 12 pages of content per book.) We brainstormed measurement words for each letter.  Some letters were tough.  We finally settled on number line for n and students were tying it to a ruler or thermometer.

We are getting the books published at StudentPublishing.com.  We had books published there earlier this year and loved them.  The software on the company's website is slow although it created a wonderful book.  We have to use the company's site to create the cover page, the title page, the dedication page and author page.  We uploaded our PDF file for the other pages.  I like this method much better.

The last time I created a chart to keep track of each student's pages as they were reviewed by an adult.  It was a long process checking each page of each book for each student and the software was slow.  I'm not checking them as closely this time as I told the students THEY should have pride in their work and THEY should make sure everything is the way they want it.  (We did do some editing with the Publisher file before converting the file to a PDF.)

The students uploaded the PDF file into their book at the publishing company's website.  We should get the books in about 4 weeks.

Thursday, February 24, 2011

Pictographs Done!

I created the "skeleton" of the pictograph for the students and then together we created the pictograph using data we created from polling the class about our favorite ice cream.  I kept it simple giving students three choices, chocolate, vanilla and other.  Each ice cream cone on the graph equaled two.  Making a 1/2 cone was interesting.  (We put a box over half of the cone and filled the box with white.) We put the "guts" into the pictograph.  The students watched me on the big screen and they did the same on their computers.  They were delighted with their graphs. 

We collected new data for each student to create their own pictograph.  We did this in about 20 minutes.  Each student picked a topic and two choices to put with a category of other.  I open the smart software and each student turned on their clicker.  I put the topic and choices on the page and the students voted.  When we were done each child had a bar graph with their data.  They turned that data into a pictograph.  This time they did the skeleton along with the guts.  :)