I wish I knew where I found the vocabulary levels so I could give the author proper credit.
Each week when introducing the new vocabulary words the students would rate the words. It can be done on paper (make a list of the words for the students and they each rate the words) or it can be done using the smartboard. (Each student had a card with the levels and meanings and a clicker.)
Personally I liked the smartboard (using clickers) because of the graph generated by the results. We would spend a little time discussing the graph and how about half the class really knew the word or less than a fourth of the class knows the word. The graph fascinated the students.
I had to remind students to be honest about their knowledge of the words. At the beginning everyone put their knowledge level of all words at 3 or 4. Once they were comfortable with the knowledge that no one would know who put the rating of 1 or 2 they were honest.
Once we rated and discussed the graphs we moved on to a powerpoint with the words. The powerpoint was loaded with pictures, clip art and video clips that were intended to help the student understand the meaning of the word. The powerpoint was set up so the word did not appear until clicked to appear. The students spent some time thinking about what word was represented, then discussed with a shoulder partner and finally I would make the word appear. They loved being right. I showed them an example of the word in a sentence then they spent some time thinking of a sentence to share with their shoulder partner.
Here are the levels (if you know who created this, please let me know):
1. I never saw it before.
2. I've heard it, but I don't know what it means.
3. I recognize it in context as having something to do with...
4. I know it well.
Showing posts with label graphs. Show all posts
Showing posts with label graphs. Show all posts
Tuesday, July 17, 2012

Friday, December 9, 2011
Gingerbread Glyphs and More
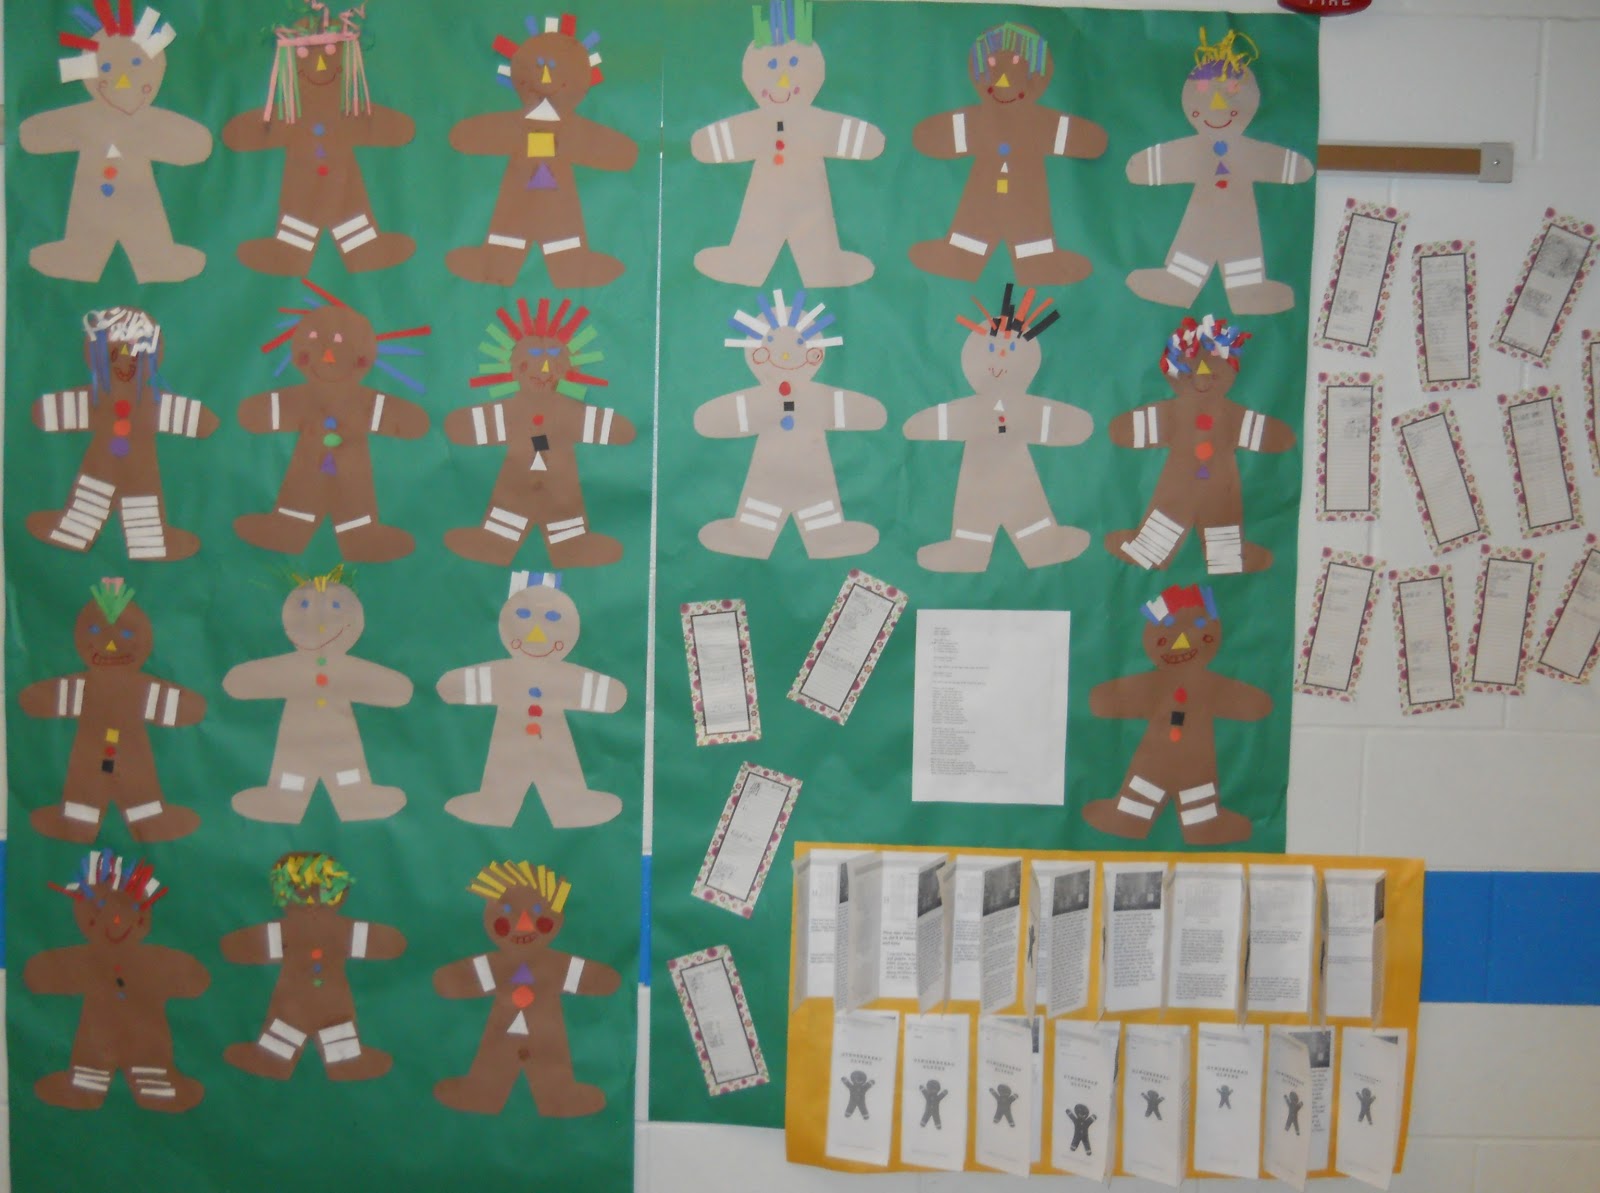
Gingerbread glyphs are a great way to brighten the hallways and combine reading and math. The glyph I like to use is from Mailbox. I found this link and used it this year. http://teachers.net/lessons/posts/1415.html
I asked the students to highlight their responses on the form. I let them choose three from the "things I like to do" list. The ages didn't fit my classroom so I changed them to fit.
After constructing the gingerbread man, each student was assigned one of the questions to collect data. We discussed tally marks and how to bundle them and why. We talked about how many tally marks should end up in the data collection.
We used the collected data to create a graph using the data. We used http://nces.ed.gov/nceskids/createagraph/default.aspx. Students downloaded their graph as a jpg file.
Next we opened Publisher and clicked on a brochure template. We deleted a lot of the information on the brochure and created our own text boxes. Adding a clip art picture of a gingerbread man added a little extra fun to our project. Each student inserted the graph they made and created a text box under it to analyze the data in their graph. Students inserted a graph from a classmate from each one of the questions. They created a text box to write about what they liked about the project and what they learned. We had one side of the brochure left so students wrote a story about their gingerbread man.

I asked the students to highlight their responses on the form. I let them choose three from the "things I like to do" list. The ages didn't fit my classroom so I changed them to fit.
After constructing the gingerbread man, each student was assigned one of the questions to collect data. We discussed tally marks and how to bundle them and why. We talked about how many tally marks should end up in the data collection.
We used the collected data to create a graph using the data. We used http://nces.ed.gov/nceskids/createagraph/default.aspx. Students downloaded their graph as a jpg file.
Next we opened Publisher and clicked on a brochure template. We deleted a lot of the information on the brochure and created our own text boxes. Adding a clip art picture of a gingerbread man added a little extra fun to our project. Each student inserted the graph they made and created a text box under it to analyze the data in their graph. Students inserted a graph from a classmate from each one of the questions. They created a text box to write about what they liked about the project and what they learned. We had one side of the brochure left so students wrote a story about their gingerbread man.
Saturday, February 26, 2011
Fluency Graph example


Friday, February 25, 2011
Fluency Graphs
I wanted the goal (123 words) to appear on the students' graphs. I googled how to put a target line on a graph and found a solution that worked for me. There may be another way, maybe even easier than what we did, but I'm happy. We just added another column of data with the goal. The goal is listed with each entry. Now we have a line showing the target number and the students can see how close they are to the goal. They read to me today to get a new number to add to their chart. Maybe I imagined it, maybe it was real, but it seemed like they all tried a little harder. They've always been interested in their fluency (words read per minute) number, but now it has become a competition to get that WRPM above the target line. They love reading to me. They love getting their new number. They love using excel to chart their growth.
They are becoming so quick at figuring out how to follow me on the computer and how to use the computer. It might be time to allow them to gather more data about themselves. Maybe a timed test on multiplication facts. I wonder if a target line on their graph for multiplication facts would inspire them as much as the WRPM. Now to figure out what would be a reasonable goal for multiplication facts in one minute....
They are becoming so quick at figuring out how to follow me on the computer and how to use the computer. It might be time to allow them to gather more data about themselves. Maybe a timed test on multiplication facts. I wonder if a target line on their graph for multiplication facts would inspire them as much as the WRPM. Now to figure out what would be a reasonable goal for multiplication facts in one minute....
Subscribe to:
Posts (Atom)